Explaining neural networks
This morning, you saw the tip of the vast iceberg that is explainable AI. Now, let's sink a bit deeper and explore why XAI methods are becoming more important, the answer to this question like the answer to a lot of other questions is - Deep Learning. The exponential use of neural networks and deep learning in various domains of application has led to a growing sense of dread - How do we trust these machines?!. The general concensus is that neural networks need to be interpretable to humans. In general, there are two approaches to make neural networks more interpretable:
- Feature visualization.
- Feature attribution.
Before we go deeper in visualizing neural networks, Lets take a step back and reflect on our own amazing ability to process, represent and reason about images. Starting with our eyes, whis is (in a very simple way) a lens which is highly sensitive to photons. However, the brain is where the magic happens. The brain takes in all these signals arising from individual photos and turns it into something that we can reason about.
Just as neural networks transform data from the original raw representations into nice representations, the brain transforms our senses from complicated high-dimensional data into nice representations, from the incomprehensible to the comprehensible. My eye detects photons, but before I even become consciously aware of what my eye sees, the data goes through incredibly sophisticated transformations, turning it into something I can reason about. The brain does such a good job that vision seems easy! It's only when you try to understand visual data without using your visual system that you realize how incredibly complicated and difficult to understand it is.
Feature visualization
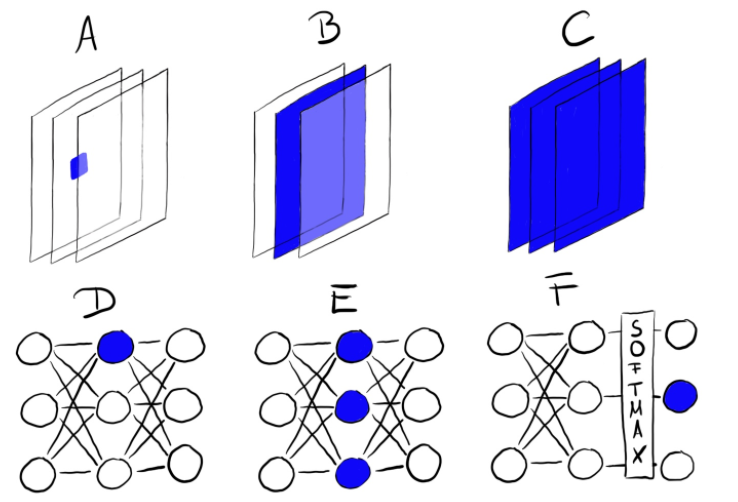
Similar to the vision processing layers in our brain, Deep neural networks attribute their performance to their capability of learning high-level features in the hidden layers. This is one of their greatest strengths and reduces the need for feature engineering. For image classification, with traditional ML, we would start by creating hand-crafted features based on color, frequency domain, edge detectors and so on. With convolutional neural networks and deep learning, the image is fed into the network in its raw form (pixels). The network transforms the image many times. First, the image goes through many convolutional layers. In those convolutional layers, the network learns new and increasingly complex features in its layers. Then the transformed image information goes through the fully connected layers and turns into a classification or prediction. The approach of making the learned features explicit is called Feature Visualization. Please watch the following video to learn more about feature visualization (and how Spotify discover weekly algorithms work!).
Feature attribution
While feature visualization methods focus on what a specific unit of a neural network place emphasis on, feature attribution methods aim to understand what parts (pixels) of an image are responsible for trigerring (or activating) a particular unit in a neural network.Inn simpler terms, feature visualization methods help us answer what a network sees, while feature attribution methods help us understand how a particular neural network architecture makes it's prediction.
The most common feature attribution method is called a saliency map — a simple heatmap that highlights pixels of the input image that most likely caused the output.
Patience you must have young Padawan. We will learn more about other forms of feature attribution this Wednesday!
[Optional] The Building blocks of interpretability
I highly recommend going through the The Building Blocks of Interpretability blog you can find here. The concepts you read about will become more clear once we apply them in the DataLab. However, please focus first on ensuring you are prepared for tomorrow's DataLab.
Preparation for tomorrow's DataLab
- Apply PDPs to your model and explain it's findings. Please open the
XAI_DataLab1_PDPnotebook you can find in your Github Repositories in Google Colab and follow the instructions provided in the Notebook.
hint: Use the following code snippet to automatically download, unzip and load the dataset into colab.
!wget https://archive.ics.uci.edu/ml/machine-learning-databases/00275/Bike-Sharing-Dataset.zip
!unzip Bike-Sharing-Dataset.zip
!ls

df = pd.read_csv("day.csv")
df.head()