Intro to Probability 2
This page continues to build your foundational knowledge of probability theory. Yesterday, we introduced the foundational concepts, and today we will continue to put our new knowledge into practice by doing 4 more modules of a swirl course. Finally, in the mock assessment, we'll do our first correlational analysis by hand!
Learning objectives: Build upon the basic understanding of data representations by learning to create data visualisations which are:
- expected values;
- variance;
- common distributions.
Table of contents:
- Workshop: 3 hours
- Mock Assessment: 2 hours
Questions or issues?
If you have any questions or issues regarding the course material, please first ask your peers or ask us in the daily Q&A at 16:00!
Good luck!
0) Workshop
Download the R swirl course Statistical_Inference by running the following code in the R-studio console:
swirl::install_course("Statistical_Inference")
Complete modules 5 to 7. Makes sure to examine the PowerPoint presentations the course asks you to open; it's useful to have different explanations of the same thing. It helps you learn: neurons that wire together, fire together. In essence, consuming multiple examples enables you to connect concepts in your brain, making it easier to recall that information.
1) Mock Assessment
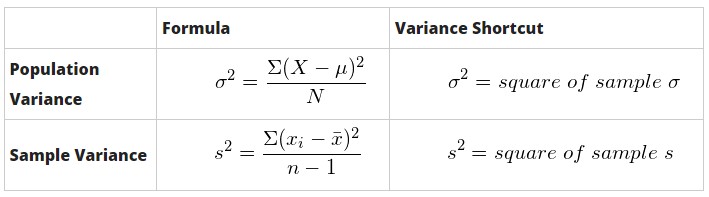
The variance, unlike the mean, is a measure of variability. Meaning, it captures the amount of spread within a variable or data set. Measures of variability are often reported alongside measures of central tendency. Meaning, the variance is typically taken with the mean or the median, as this helps form a greater picture of what the data set looks like. Below are the formulas for the variance:
Take a piece of paper and calculate the following by hand:
- Given the following information, find the population variance.
| Measure | Value |
|---|---|
| σ2 | 50 |
| μ | 4 |
- Find the sample variance for age(i) of the following data:
| Subject | Age (i) |
|---|---|
| 1 | 29 |
| 2 | 30 |
| 3 | 31 |
| 4 | 45 |
| 5 | 28 |
| 6 | 26 |
| 7 | 25 |
Hint: What is the mean? Where do we plug it in? And what do we do then with that sigma notation, or sum notation, we learned last week?
- Calculate the sample variance of the data sets given the following information:
| Data set | Mean | SD | Sample Size |
|---|---|---|---|
| A | 715 | 55 | 1500 |
| B | 634 | 42 | 2300 |
Photograph your calculations, name them "VarianceMockAssessment1" (if you have more photos, continue the count: e.g. 2,3,4) and upload them to your github repo.
3) Daily Q&A
At 16:00, there's an online meeting on our Microsoft Team Channel you're encouraged to take part in to ask questions and to discuss our progress and reflect on today activities.
That's it for today! Tomorrow we're going to discuss our mock assessment with our classmates and learn how to analyse different relationships between variables.