DataLab 1: Data wrangling & UX design in Power BI

1. Introduction
In this DataLab session, you are going to load, clean, and/or transform the youth care data in Power BI.
If you have not finished the Microsoft tutorial modules and corresponding lab exercises, make sure to finish them before you start working on the client's youth care dataset.
2. Q&A and Standup
2a Ask questions regarding the independent study material.
2b Answer the following questions:
- What did you do yesterday?
- What will you do today?
- Are there any impediments in your way?
3. Data wrangling
3a Load the .pbix file named DatamodeljeugdTESTDATA, which contains the client's youth care dataset, in Power BI.
3b Apply the knowledge you have gained, through completing the Microsoft tutorial modules and lab exercises, on the youth care dataset.
4. Creating your own layout in Power BI
What is user experience design (UX)? And why is it important to use UX principles when building a dashboard report?
4a Watch the YouTube video ‘Don Norman: The term "UX"', where Don Norman shares his thoughts on the origin of the term UX and how we should and should not use the term.
Video 1. Don Norman: The term "UX".
In his blog on UsabilityGeek, Justin Mifsud explains why it is important to make data user-friendly:
If the designer fails to make data user-friendly, then the user consuming such data will be impeded from extracting the meaning underlying the graphics, numbers or text. Worse still, the user will end up sifting mindlessly through such data, trying to make sense of it – not much different than they would have done had they been presented with raw data. Therefore, proper information visualisation leads to fast and accurate data consumption, which in turn can be used to make comparisons, draw conclusions and take decisions. A crucial mantra to keep in mind is that while technology has rapidly evolved, this has not been met with a parallel evolution of the human being. In this regard, the dashboard designer must understand and support the nature and limitations of human perception (Mifsud, Dashboard design user experience guidelines, n.d.).
4b Explore the website of the municipality of Oosterhout and take a closer look at their corporate design (e.g. colours, logo etc.).
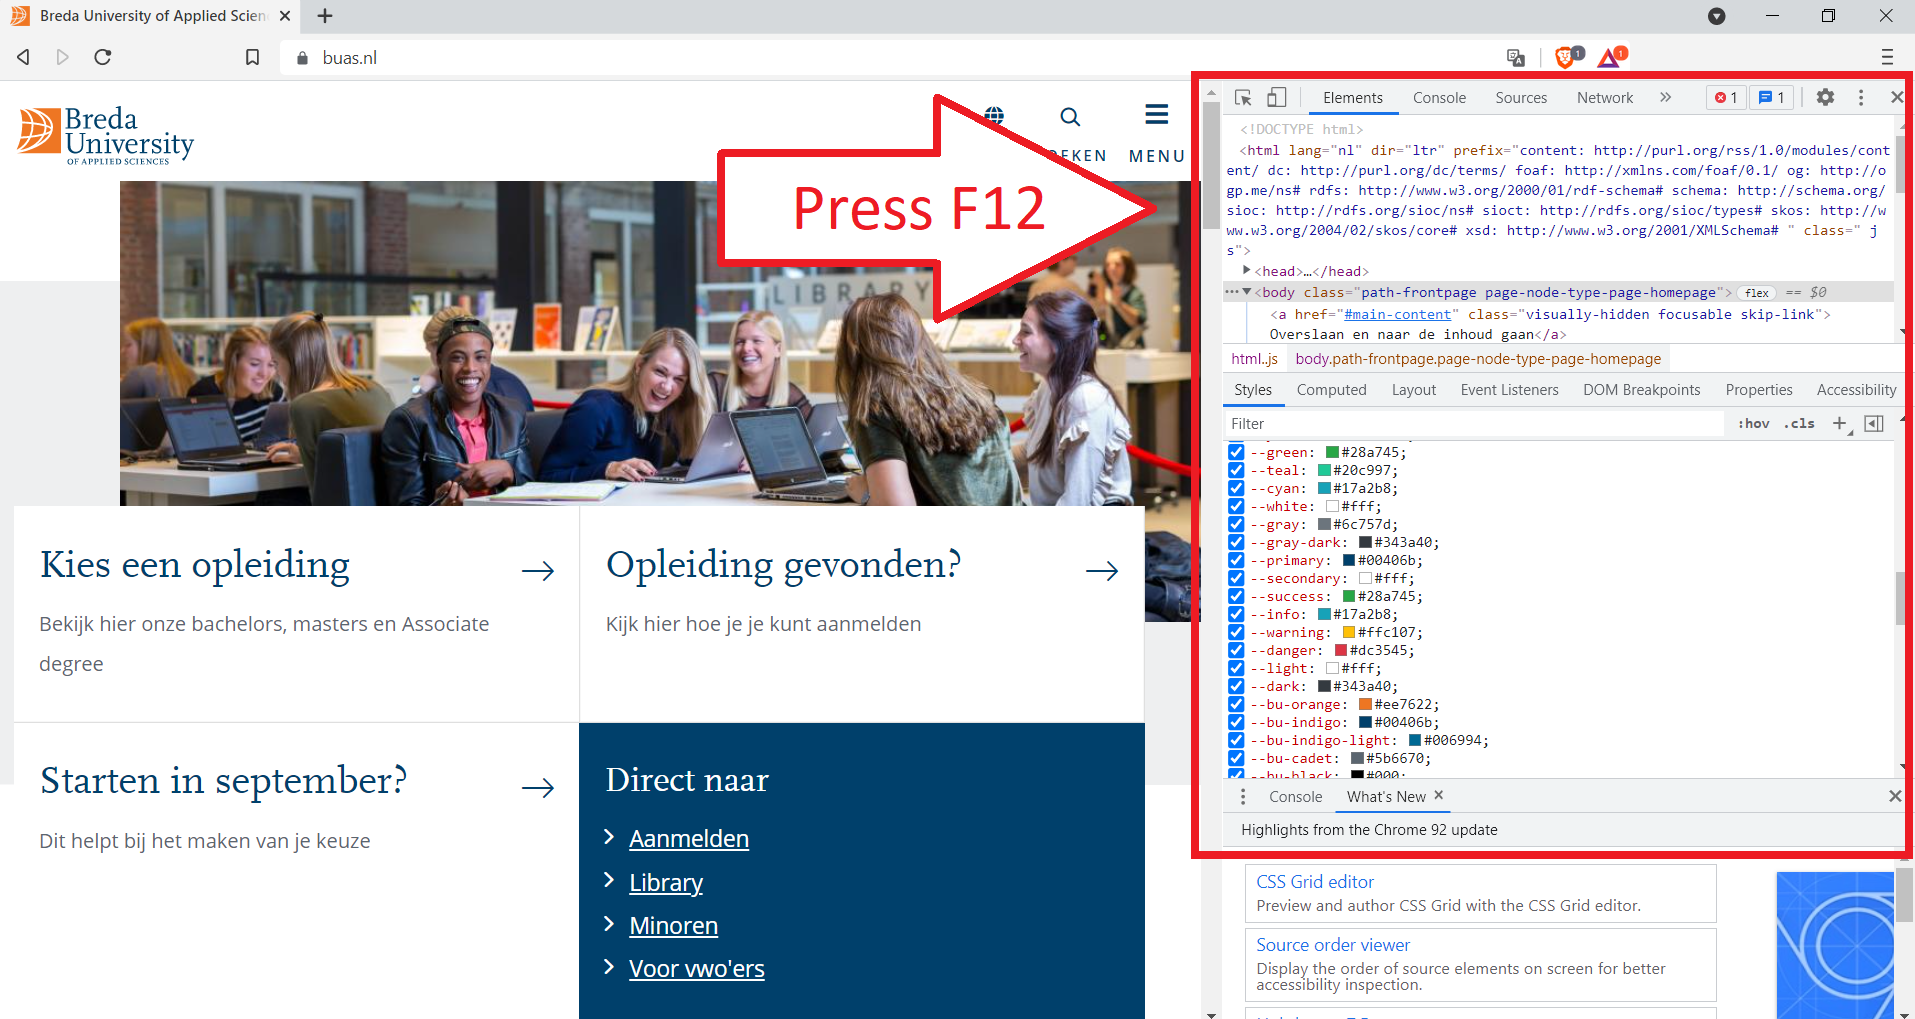
Figure 1. Example of what happens when you press F12 on a website in a browser.
4c Design a layout for the client's youth care Power BI dashboard, see the article Creating Power BI layouts.
4d Create a document that contains a selection of meta-information of the layout you created for exercise 3c (e.g. font, colour etc.).
5. Reflection & Work/learning log (16:00-17:00)
5a Fill in your work/learning log.
5b Choose, and provide an answer to at least of the following questions:
- What surprised you today, and why?
- What is the most important thing you learned today? Why do you think so?
- What do you want to learn more about, and why?
- When were you the most creative, and why do you think that is?
- What made you curious today? How does learning feel different when you are curious?
- When were you at your best today, and why?
- (Assuming we were studying the same thing and you could decide and have access to anything), where would you start tomorrow? Why?
- What can/should you do with what you know?