Data engineering: Data architecture & pipeline design

1. Introduction
Hi everyone! Today we are going to start with Block B (Spoiler: We are going to work on a real-life business case. More on this in Datalab 1 ![]() )
)
For the first half of the day, you will be made familiar with the core concepts of data architecture & pipeline design. For example, you will explore the ETL process and learn how to design tables in a data warehouse.
If you have questions regarding the study material, you can send us an email. For details on availability see Project Brief.
1a Complete module 1. Data Warehouse Foundations of the LinkedIn course Implementing a Data Warehouse SQL Server 2019 by Adam Wilbert, which you can find here.
2. Data pipeline
A traditional data pipeline transports raw data from software-as-a-service (SaaS) platforms and database sources to data warehouses for use by analytics and business intelligence (BI) tools, such as Power BI (introduced in week 3!). In this section, we are going to review the various components and stages of a data pipeline.
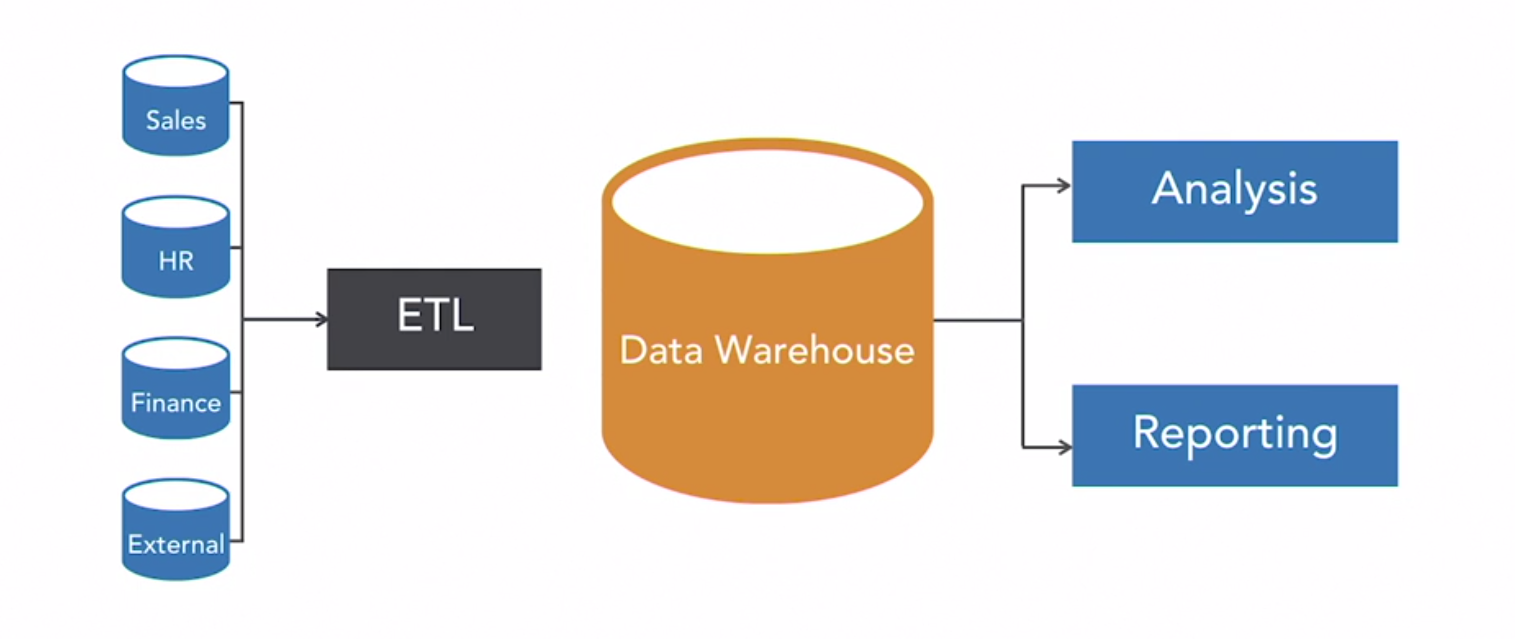
Figure 1. Business intelligence system.
2a Define the term ‘data warehouse'. Write your answer down.
2b List three core concepts of a data warehouse. Write your answer down.
2c List at least one benefit and one weakness of using a data warehouse. Provide a context, i.e. business setting, for each of your benefit(s)/weakness(es). Write your answer down in a maximum of 150 words.
2d Read IBM's blog on OLAP and OLTP systems, which you can find, here.
2e As a data analyst, you are given the task to provide a list of the company's top 10 best-selling items. Should you retrieve your data from the company's OLAP or OLTP system? Explain your answer.
3. Designing a data warehouse
3a Read pages 10-17 of the book The data warehouse toolkit by Kimball and Ross (2013) (optional).
3b Define the term ‘star schema'. Write your answer down.
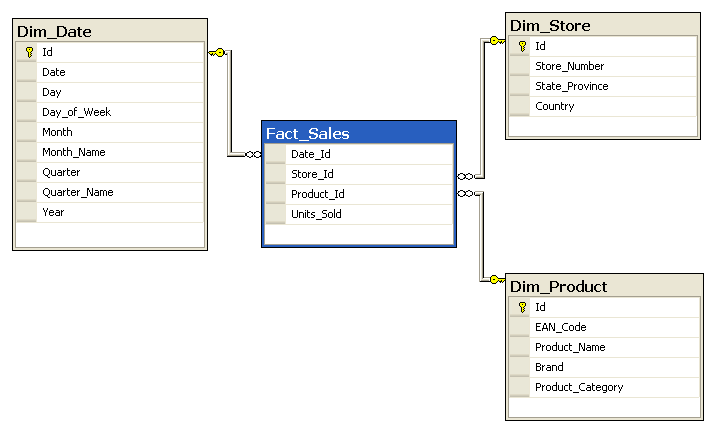
Figure 2. Example of a star schema with fact and dimension tables.
3c Provide an example of a selection of facts and dimensions joined in a star schema. You can use Google's Jamboard or a simple piece of paper for your schema. Export/import your drawing to PNG, and upload it to your GitHub repository.
3d Describe the ETL process. Write your answer down in a maximum of 150 words.
3e Create an infographic that covers the topics (of the first two modules) of the LinkedIn course Data Warehouse SQL Server 2019 by Adam Wilbert. You can use Google's Jamboard or a simple piece of paper for your infographic. Export/import your drawing to PNG, and upload it to your GitHub repository.
Literature
Kimball, R., & Ross, M. (2013). The data warehouse toolkit: The definitive guide to dimensional modeling. (Free access through BUAS' MetaSearch).