Fairness & Bias: Group fairness metrics
Today's independent study material will introduce you to the theories behind group fairness metrics, which include, but are not limited to: equalized odds, equal selection parity, and demographic parity. During the workshop, you will learn to apply these metrics to a tabular toy dataset.
Learning objectives
- Compare, and contrast two philosophical ‘worldviews': WAE, and WYSIWIG.
- Compare, and contrast three notions of fairness in AI: ‘interdependence', ‘sufficiency', and ‘separation'.
- Propose, and apply appropriate group fairness metrics to a tabular toy dataset.
Table of contents:
- Introduction: 3 hours
- Workshop: 3 hours
- Additional material (optional): 1 hour
- Preparation DataLab: 10 minutes
Questions or issues?
If you have any questions or issues regarding the course material, please first ask your peers or ask us in the Q&A in Datalab!
Good luck!
1) Introduction
Most post-processing group fairness metrics are calculated based on a confusion matrix produced by a classification model. The confusion matrix is comprised of four outcomes:
- True positive (TP): the true class is positive and the prediction is positive (correct prediction)
- False positive (FP): the true class is negative and the prediction is positive (incorrect prediction)
- True negative (TN): the true class is negative and the prediction is negative (correct prediction)
- False negative (FN): the true class is positive and the prediction is negative (incorrect prediction)
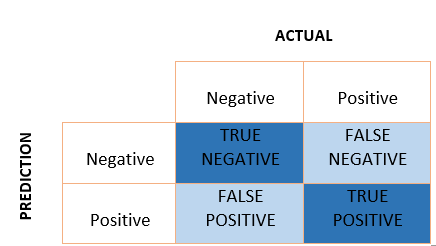
Figure 1. Confusion matrix.
Group fairness metrics are calculated by comparing one or more of these measures across sensitive/protected attribute groups. For example, gender or marital status could be considered such an attribute, with groups ‘Female' and ‘Male' for gender, and ‘Married', ‘Not-married' for marital status.
1a Read AXA's Towards the right kind of fairness in AI guide (p. 1-55). This text will introduce you to a number of popular group fairness metrics used in the field of AI.
1b Read the blog post Starting to think about AI Fairness by RStudio. This article will summarize and connect many of the essential concepts covered in the independent study material.
1c Define the term ‘group fairness', and explain how it differs from ‘individual fairness'. Write your answer down.
1d Give at least one additional example of a feature that could be seen as a sensitive/protected attribute?
1e Watch the video MFML 044 - Precision vs recall by Google's Cassie Kozyrkov.
Video 1. Precision vs recall by Cassie Kozyrkov.
Mnemonic:
- Precision: ‘Don't waste my time'.
- Recall: ‘Collect ‘em all'.

Figure 2. Precision vs. recall.
1e Explain the differences between ‘independence', ‘sufficiency', and ‘separation' concerning fair AI.
1f Explore the interactive tutorial Attacking discrimination with smarter machine learning to see how a binary classifier works, ways it can potentially be unfair, and how you might turn such an unfair classifier into a fairer one.
1.1 Fairness Compass
To select an appropriate group fairness metric for our (binary) classification task, we will use AxA's Fairness Compass.
Example: The search engine SearchYourWeb has a database containing 1500 wedding images; depicting 500 homosexual and 1000 heterosexual couples. When searching for wedding images, the engine returns a sample of 150 pictures labelled ‘Wedding'.
Sensitive/protected attribute: sexual orientation (e.g., groups: homosexual and heterosexual).
Step 1: Policy/'worldview'
- ‘We're all equal' (WAE) OR ‘What you see is what you get' (WYSIWIG)
The worldview what you see is what you get (WYSIWYG) assumes the absence of structural bias in the data. Accordingly, this view supposes that any statistical variation in different groups actually represents deviating base rates which should get explored. On the other hand, the worldview we're all equal (WAE) presupposes equal base rates for all groups. Possible deviations are considered as unwanted structural bias that needs to get corrected (Source).
Types of bias:
- Statistical bias (WYSIWIG):
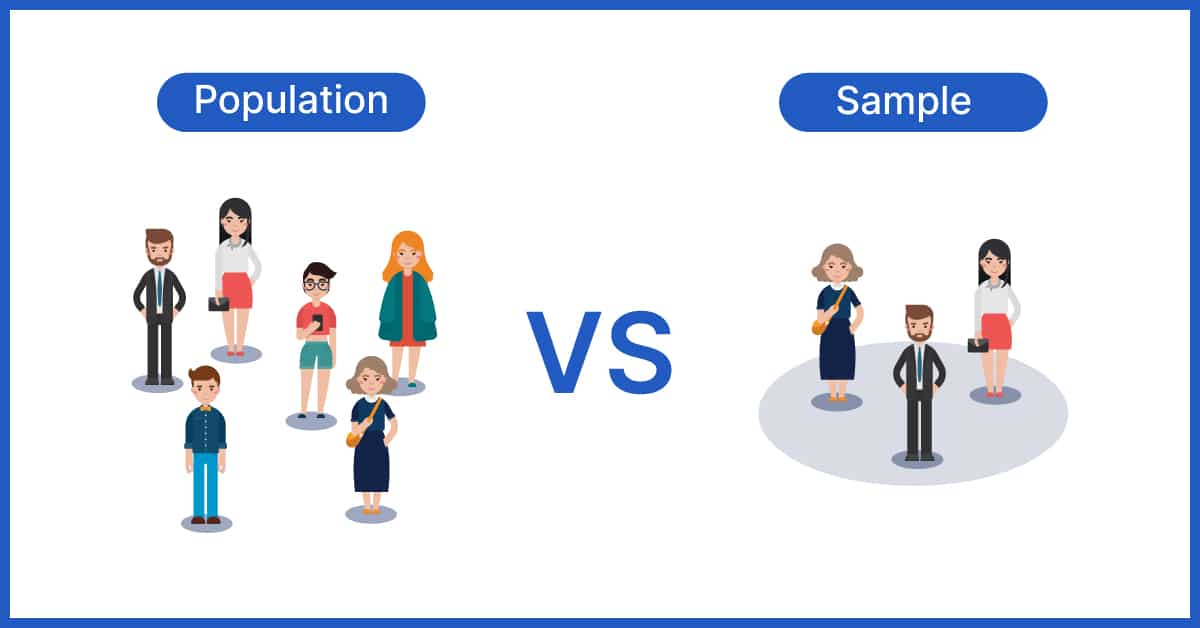
Figure 3. Population vs. sample.
Generally speaking, statistical bias occurs whenever the data used for model training are not representative of the true population. This can be due to a form of selection bias, i.e. when the individuals appearing in the data come from a non random selection of the full population. This happens, for example, in the context of credit lending, where the information of the repayment is known only for people that were granted the loan. Another way in which statistical bias can enter the data is via systematic measurement errors. This happens when the record of past errors and performance is systematically distorted, especially in the case of different amount of distortion for different groups of people. Similarly, it may happen that data are systematically missing or poorly recorded for entire strata of the population (Source).
- Historical or societal bias (WAE):
Even when the data are free from statistical bias, i.e. they truly represent the population, take into account minorities and there is no systematic error in recording, still it may be that bias exists simply because data reflect biased decisions. In most cases, this is due to a form of labelling bias, i.e. a systematic favour/disfavour towards groups of people at the moment of creating the target variable from which the model is going to learn. If the recorded outcomes are somehow due to human decisions (e.g. a model for granting loans may be trained on loan officers' past decisions), then we cannot in general trust their objectiveness and "fairness". Other forms of historical bias may be even more radical: gender bias has a rather long history, and is embedded in all sorts of characteristics and features in such a way that it is difficult or even impossible to evaluate its impact and disentangle its dependence on other variables. Think for example of income or profession disparities, just to name a few out of many. Thus, this is a situation in which long-lasting biases cause systematic differences in features pertaining different groups of people. Again, this is not a form of un representativeness of the sample, it is a bias present in the full population (Source).
Step 2: Fairness metrics
Independence (WAE):
- ‘The proportion of actual positives (i.e., base rate) must be equal across sensitive/protective groups'.
Base rate: (TP privileged group + FN privileged group)/(TP privileged group + FP privileged group + TN privileged group + FN privileged group) = (TP unprivileged group + FN unprivileged group)/(TP unprivileged group + FP unprivileged group + TN unprivileged group + FN unprivileged group)
Independence ensures that individuals, who have different sensitive/protected attribute values \(\begin{aligned} & A\end{aligned}\) , have an equal chance to obtain correct predictions.
In mathematical terms, independence requires the sensitive/protected attribute \(\begin{aligned} & A\end{aligned}\) to be unconditionally independent of \(\begin{aligned} & \hat{Y}\end{aligned}\) :
\[P(\hat{Y}=1 \mid A=a)=P(\hat{Y}=1 \mid A=b), \quad \forall a, b \in \mathcal{A}\]Fairness metric I: ‘The number of predicted positives should be equal across sensitive/protective groups'.
Equal selection parity: (TP privileged group + FP privileged group) = (TP unprivileged group + FP unprivileged group)
OR
Fairness metric II: ‘The proportion of predicted positives should be equal across sensitive/protective groups'.
Demographic parity: (TP privileged group + FP privileged group)/(TP privileged group + FP privileged group + TN privileged group + FN privileged group) = (TP unprivileged group + FP unprivileged group)/(TP unprivileged group + FP unprivileged group + TN unprivileged group + FN unprivileged group)
Equal selection parity is satisfied when the search engine returns the same number of images for each sensitive/protected attribute group; 75 wedding images depict homosexual couples, and 75 heterosexual couples.
Demographic parity is satisfied when their base rates are the same; 50 images depict homosexual couples, and 100 images depict heterosexual couples (i.e., the favorable outcome should be assigned to each group of a sensitive/protective attribute at equal rates).
The WAE worldview does not automatically assume that the \(\begin{aligned} & Y\end{aligned}\) values represent the ‘ground truth'; they are constructed through historical or societal bias. The fairness notions related to WAE, independence, thus solely relies on the distribution of features and decisions, namely on (\(\begin{aligned} & A\end{aligned}\), \(\begin{aligned} & X\end{aligned}\), \(\begin{aligned} & \hat{Y}\end{aligned}\)) (See Codebook).
Separation & Sufficiency (WYSIWIG):
- ‘The proportion of actual positives (i.e, base rate) do not have to be equal across sensitive/protective groups'.
Justification varying base rate: Research by Statistics Netherlands/Centraal Bureau has shown that heterosexual couples are far more likely to get married than homosexual couples; 80% of Dutch heterosexual couples are married, while only 20% of Dutch homosexual couples are married (Source). A fair ML model should take this discrepancy, as a condition, into account.
A. Separation:
Separation ensures that individuals who actually belong to the same class (\(\begin{aligned} & Y\end{aligned}\)), but who have different sensitive/protected attribute values (\(\begin{aligned} & A\end{aligned}\)), have an equal chance to obtain correct predictions –> TPR (i.e. recall) and/or TNR (i.e. specificity).
In mathematical terms, separation requires the \(\begin{aligned} & \hat{Y}\end{aligned}\) to be conditionally independent of the sensitive/protected attribute \(\begin{aligned} & A\end{aligned}\) given \(\begin{aligned} & Y\end{aligned}\) :
\[\begin{aligned} P(\hat{Y}=1 \mid A=a , Y=y) = P(\hat{Y}=1 \mid A=b , Y=y), \\ & \forall a, b \in \mathcal{A}, y \in\{0,1\}. \end{aligned}\]Fairness metric I: The true positive rates (TPR) should be equal across sensitive/protective groups'.
Equalized opportunities: (TP privileged group/(TP privileged group + FN privileged group) = (TP unprivileged group/(TP unprivileged group + FN unprivileged group)
Equalized opportunities is satisfied when the return rates for the images labelled ‘wedding' are equal across sensitive/protected groups.
B. Sufficiency:
Sufficiency ensures that individuals with identical predictions (\(\begin{aligned} & \hat{Y}\end{aligned}\)), but with different sensitive/protected attribute values (\(\begin{aligned} & A\end{aligned}\)), have an equal chance to obtain correct predictions –> PPV (i.e., precision) and/or NPV.
In mathematical terms, sufficiency requires the \(\begin{aligned} & Y\end{aligned}\) to be conditionally independent of the sensitive/protected attribute \(\begin{aligned} & A\end{aligned}\) given \(\begin{aligned} & \hat{Y}\end{aligned}\):
\[\begin{aligned} P(Y=1 \mid A=a, \hat{Y}=1) = P(Y=1 \mid A=b, \hat{Y}=1), \\ & \forall a, b \in \mathcal{A}, \end{aligned}\]Fairness metric II: ‘The positive predictive value (PPV) should be equal across sensitive/protective groups'.
Predictive parity/Precision/PPV : TP privileged group/(TP privileged group + FP privileged) = TP unprivileged group/(TP unprivileged group + FP unprivileged group)
Predictive parity/Precision/PPV is satisfied when the proportion of correctly returned images is equal across sensitive/protected groups.
Codebook
| Mathematical notation | Description |
|---|---|
| \(\begin{aligned} &Y\end{aligned}\) | True/Actual label (i.e. ‘negative'/'unfavorable' = 0, and ‘positive'/'favorable' = 1) |
| \(\begin{aligned} &\hat{Y}\end{aligned}\) | Predicted label (by ML model) (i.e. ‘decisions') |
| \(\begin{aligned} &A\end{aligned}\) | Sensitive/protected attribute (binary) group/class label (i. e. ‘negative'/'underprivileged' = 0, and ‘positive'/'privileged' = 1) |
| \(\begin{aligned} &X\end{aligned}\) | Features (i.e. independent variables or predictors) |
2) Workshop: Fairness metrics in Python (Part 2)
Now, we are introduced to various group fairness metrics, it is time to deepen our knowledge. In the workshop, you will learn how to apply these metrics in a binary classification task.
2a Complete the Responsible AI: Group fairness metrics notebook.
Dataset:
3) Additional material (optional)
This part of the independent study material is optional. You are not required to complete the following questions. However, they will help you to deepen your understanding of the concepts presented in the independent study material.
3.1 Justice as fairness by John Rawls
Stanford Encyclopedia of Philosophy is a trustworthy online source that provides extensive information on philosophy, and related fields. You can access their entry on the philosopher John Rawls, here.
In addition, The School of Life, also has provides high quality videos on various philosophical topics. See YouTube video on Rawl's political theory:
Video 2. Political Theory, John Rawls.
4) Preparation for DataLab 2
- Upload your completed Responsible AI: Group fairness metrics notebook to GitHub.
Resources
Castelnovo, A., Crupi, R., Greco, G., & Regoli, D. (2021). The zoo of Fairness metrics in Machine Learning. arXiv preprint arXiv:2106.00467.
Ruf, B., & Detyniecki, M. (2021). Towards the Right Kind of Fairness in AI. arXiv preprint arXiv:2102.08453.