Getting started with Power BI & Prepare data for analysis with Power BI

1. Introduction
During this independent study day, you will be introduced to one of the most popular business intelligence tools, Microsoft's Power BI. For the majority of Week 3, you will be following Microsoft's data analyst associate tutorial. This tutorial will teach you all the basic skills needed to build insightful and visually pleasing dashboards:
Figure 1. Microsoft Certified: Data Analyst Associate.
Note: After completing Microsoft's data analyst associate tutorial, you should be able to pass the corresponding exam. For more information, see Exam DA-100: Analyzing Data with Microsoft Power BI or contact one of your lecturers.
2. Introduction to Power BI
2a Watch the YouTube video ‘What is Power BI?' by Guy in a Cube.
Businesses need data analysis more than ever. In this learning path, you will learn about the life and journey of a data analyst, the skills, tasks, and processes they go through in order to tell a story with data so trusted business decisions can be made. You will learn how the suite of Power BI tools and services are used by a data analyst to tell a compelling story through reports and dashboards, and the need for true BI in the enterprise (Microsoft Certified: Data Analyst Associate, Get started with Microsoft data analytics).
2b Complete the modules Get started with Microsoft data analytics and Get started building with Power BI of the Microsoft Certified: Data Analyst Associate tutorial, which you can find here.
2c List at least one business intelligence dashboarding tool, and compare and contrast it with Power BI, taking into regards elements such as ‘spatial data', ‘cost', ‘security' etc. Write your answer down in a maximum of 150 words.
3. Prepare data for analysis in Power BI
You will explore Power Query as you learn to extract data from different data sources and choose a storage mode and connectivity type. You will learn to profile, clean, and load data into Power BI in preparation for modeling your data (Microsoft Certified: Data Analyst Associate, Prepare data for analysis).
3a Complete the modules Get data in Power BI and Clean, transform, and load data in Power BI of the Microsoft Certified: Data Analyst Associate tutorial, which you can find here.
There is a big difference between absorbing information and putting what you have learned into practice. Without doing the latter, the training you have received will go to waste. Therefore, you are going to apply your newly acquired Power BI knowledge to a famous Microsoft dataset/database called AdventureWorks. Each of the lab exercises (do not confuse them with the DataLab sessions!) take approximately 45 minutes to complete.
You can either complete the lab exercises in a Virtual Machine (VM) provided by Microsoft on their website or you can complete them on your local device (a.k.a. laptop). Setting up the lab exercises on your local device takes a bit more effort at first, but it will greatly reduce the time spent on loading the exercises in Power BI.
All in all, there are two options:
Power BI in a VM (online)
Step 1. Access the lab exercises through the learning paths of Microsoft Certified: Data Analyst Associate.
or
Power BI on a local device
Step 1. Install Microsoft SQL Server 2019, and Microsoft SQL Server Management Studio.
Video 1. How to download and install Microsoft SQL Server 2019 database and SQL Server Management Studio by Lie Jenn.
Step 2. Git clone Microsoft's DA-100: Analyzing Data with Power BI GitHub repository. Step 3. Manually add AdventureWorksDW2020.bak (location: DA-100-Analyzing-Data-with-Power-BI –> Allfiles –> DA-100-Allfiles –> DatabaseBackup) to your databases listed in Microsoft SQL Server Management Studio. Follow the instructions provided in the section ´Restore to SQL Server´ from Microsoft's AdventureWorks sample databases article, which you can access here.
Video 2. How to download and import AdventureWorks sample database for Microsoft SQL Server 2019 by Lie Jenn.
For the DataLab sessions, you need to install Power BI Desktop on your local device. If you have not installed it yet, please do so! You can download the software, here.
3b Complete Module 2 - Get Data in Power BI and Module 3 - Clean, Transform, and Load Data in Power BI lab exercise, which you can find here.
When everything fails, you can use the AdventureWorks dashboard template. See teams folder Class Materials –> Business Intelligence –> Data –> AdventureWorks2020.pbix
4. Additional resources (optional)
As a data analyst, it is important to identify the needs of your client (i.e. CRISP phase 1: Business Understanding – What does the business need?). What are useful KPIs? What does the term ‘toewijzing' mean? Or when is somebody eligible to receive youth care within the municipality of Oosterhout? When you can answer these kinds of questions, you will be much better equipped to deliver an insightful dashboard report.
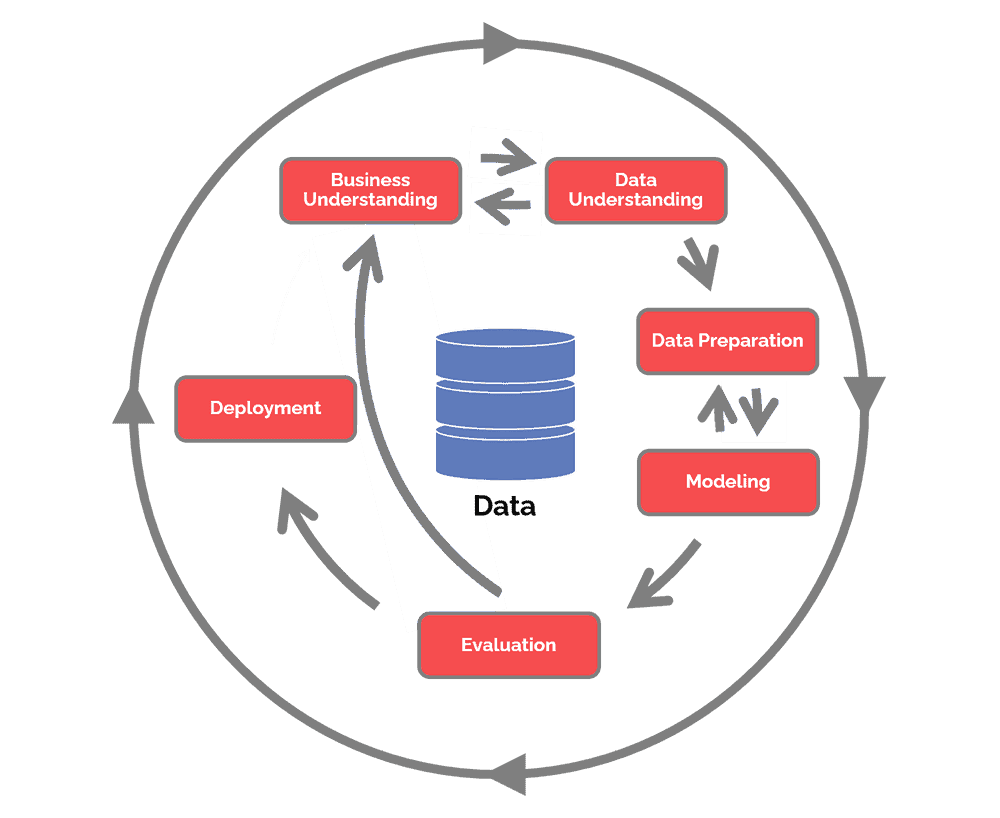
Figure 2. CRISP-DM cycle.
Do you have time left, and want to create a dashboard that can help the municipality of Oosterhout to improve its youth care policy, explore the following additional resources:
- Hilverdink, P., Daamen, W., & Vink, C. (2015). Children and youth support and care in the Netherlands. Utrecht: Netherlands Youth Institute.
- Gervink, C. M. (2018). The contemporary state of youth care: Impact of the decentralization on youth care employees: How decentralization of youth care influenced how youth care employees carry out their work and how they cope with the changes in their working conditions. (Master's thesis, University of Twente).
Literature
Gervink, C. M. (2018). The contemporary state of youth care: Impact of the decentralization on youth care employees: How decentralization of youth care influenced how youth care employees carry out their work and how they cope with the changes in their working conditions (Master's thesis, University of Twente).
Hilverdink, P., Daamen, W., & Vink, C. (2015). Children and youth support and care in the Netherlands. Utrecht: Netherlands Youth Institute.