Introduction to Business Intelligence
Assignment
Part 1: Pre-processing
By now you should have mastered the basics of SQL and data architecture & pipeline design (Datalab 2, Week 1). The knowledge you acquired so far will enable you to complete this section of the assignment. You will work with two data sources:
- A PostgreSQL database containing both socio-economic and health data. Hereinafter, data collection 1.
- A csv./flat-file containing health data. Hereinafter, data collection 2.
Figure 1. Joining tables in SQL…
Additionally, you will have to prepare and run various SQL queries on the loaded data. After you have successfully prepared and run the queries, listed in the procedure below ![]() , you should be familiar youth care dataset.
, you should be familiar youth care dataset.
Requirements:
For this part of the assignment, we work with three levels that correspond to the proficiency levels in the assessment form (except the ‘Missing' criterion). For example, to get a ‘Sufficient' on this section of the assignment you should master the skills listed in the yellow block (i.e. Level 2)
Elementary SQL queries & Modifying databases in SQL 1
A) Prepare, and run SQL queries that use DELETE, UPDATE, SET, ADD, SELECT INTO, INSERT INTO SELECT, CREATE TABLE, ALTER TABLE, and COPY.
B) Prepare, and run SQL queries that use SELECT, FROM, ORDER BY, WHERE, IN, BETWEEN, OR, AND, NOT, LIKE, EXISTS, and LIMIT.
Intermediate SQL queries
A) Prepare, and run SQL queries that use COUNT, SUM, MIN, MAX, AVG, GROUP BY, DISTICT, DISTICT ON, HAVING, DATE, and CASE.
Modifying databases in SQL 2
B) Prepare, and run SQL queries that use LEFT JOIN, INNER JOIN, OUTER JOIN, IS NULL, and IS NOT NULL.
A) Prepare, and run SQL queries that use PRIMARY KEY, FOREIGN KEY, and REFERENCES.
Advanced SQL queries
A) Prepare, and run SQL subqueries.
Procedure:
Each colour block corresponds to a specific criterion of ILO 4.1. To attain a certain skill level, e.g. yellow (Level 2, ‘Sufficient'), you need to answer all the questions in the corresponding colour block correctly.
2. Install a client that is compatible with PostgreSQL (e.g. DBeaver, pgAdmin etc.), and connect them.
3. Place the data collection files into your computer's 'Public' folder (e.g. C:\Users\Public).
4. Load data collection 1 into your PostgreSQL database (for instructions, see Importing and exporting Database in Postgres Using PGadmin).
b) Import data collection 2 into the table health by using the COPY statement.
6. Produce a list of instances (maximum of 5) where the value of column [...], located within the table health, exceeds a certain value.
b) Use the statement ROUND() to turn your calculated averages into integers.
c) Insert the newly created values into the first row into the socio_eco table.
d) Rename the table socio_eco_v2.
b) Create a table where you store the result from question 8a , and name it query_result.
9. Connect the tables from data collection 1 in the database by specifying appropriate relationships:
a) Draw an ERD (a.k.a. relational database schema) by hand or automatically generate one in your database client.
b) Prepare, and run the SQL clause(s).
c) Explain your approach.
Deliverable(s):
- A .sql-file, and a picture with the answers to the SQL assignment questions (i.e. SQL code, and additional written/drawn explanations).
The .sql-file, and the picture with the ERD are to be uploaded to GitHub Classroom no later than 5pm on last DataLab day. Confer with a lecturer beforehand if you are handing in something other than a .sql-file and/or picture.
Part 2: Analysis & Visualization
For part 2 of the assignment, you are going to perform operations on the youth care data to provide insightful visualizations (See ILO 4.2).
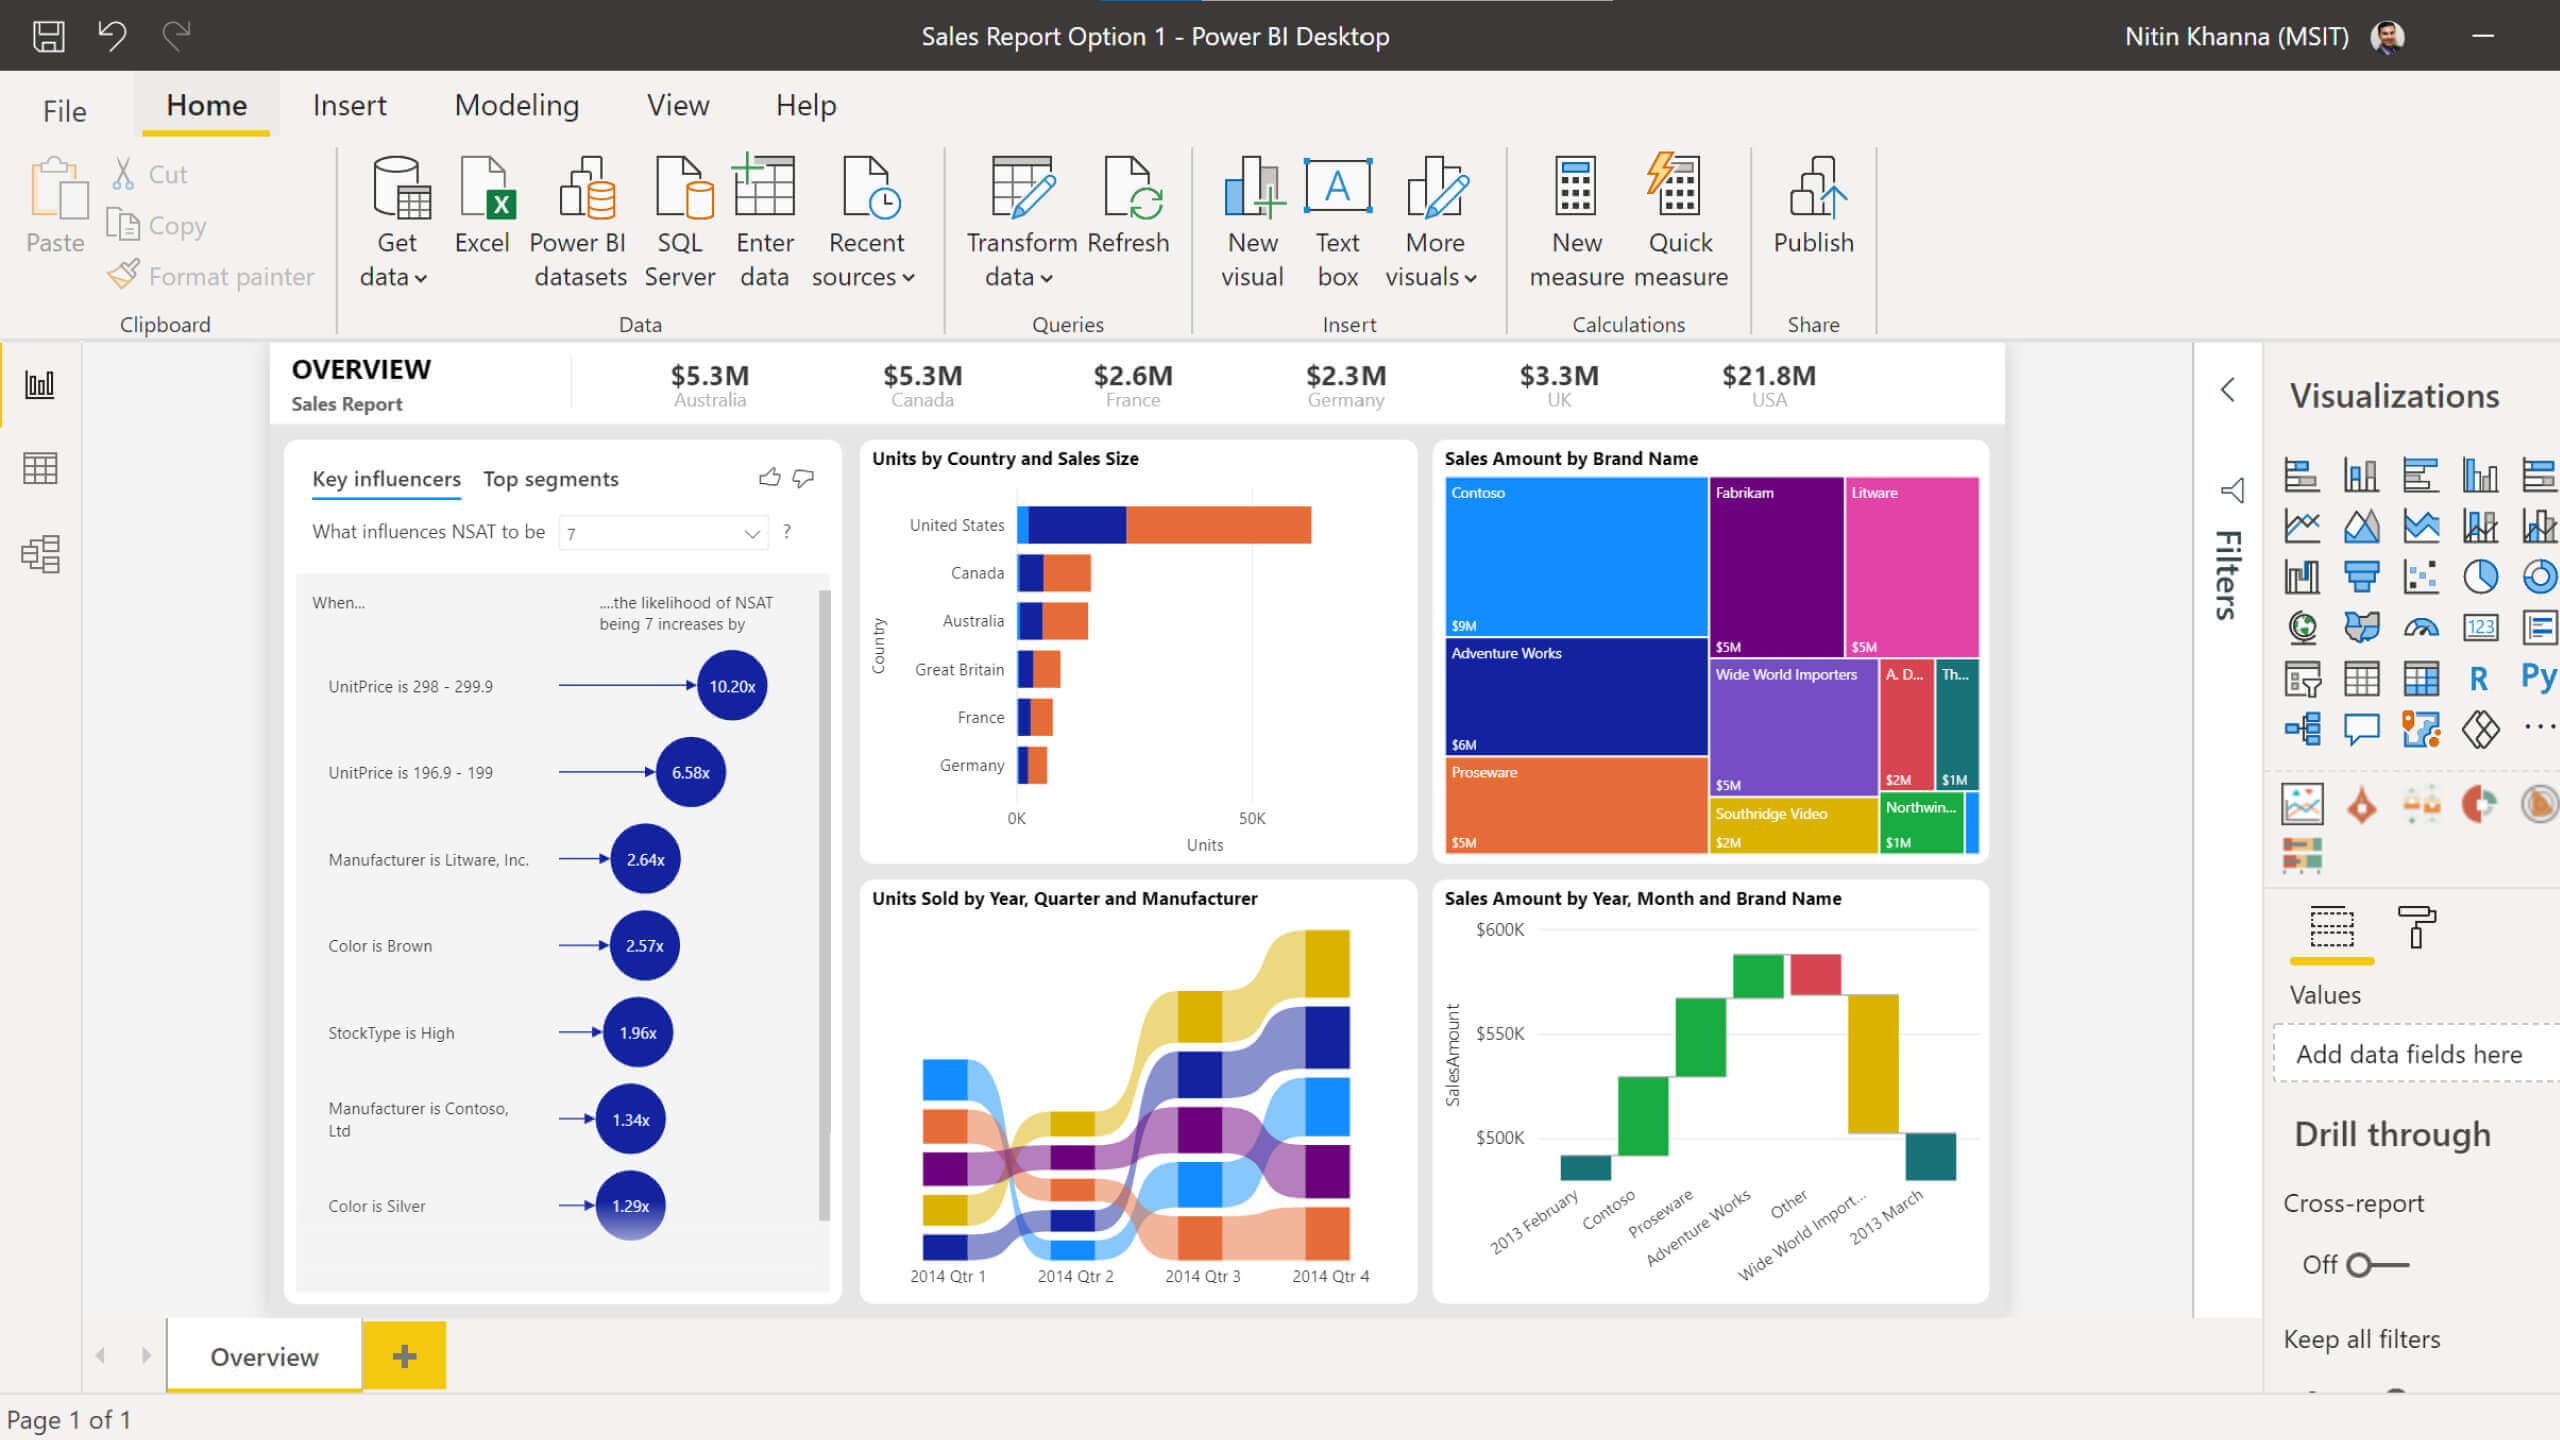
Figure 2. Power BI dashboard example
Requirements:
- Create a maximum of 5 dashboard pages.
- Import the results from ML analyses, in ‘flat-file' format, to Power BI.
- Clean and/or transform the data that is imported into Power BI.
- Use visualizations that are appropriate for the data type you are working with. See Microsoft's visualization guideline in Literature.
- Visualize descriptive statistics in the dashboard.
- Visualize results of the ML model(s) in the dashboard.
- Record or perform a live demo of the dashboard (to stakeholders). The demo should not take longer than 5 minutes.
- Provide a pleasant User experience (UX) for the dashboard: layout, buttons etc. See book by Stull (2018) in Literature.
- Optimize (a part of) the data pipeline (i.e. dashboard) in terms of performance and security. See Microsoft's (e.g. Kesselman et al.) optimizing performance and security in Literature.
Deliverable(s):
- A Power BI dashboard in .pbix-format.
- A recorded or live demo of the Power BI dashboard.
- Additional documentation (e.g. filters per page, codebook etc.)
For information on how to record your demo, see Windows 10s screen recorder tool guide.
The Power BI dashboard in .pbix-format and the additional documentation is to be uploaded to GitHub Classrooms no later than 5pm on last DataLab day.
The recorded demo of the Power BI dashboard is to be uploaded to GitHub Classrooms no later than 5pm on last DataLab day. Confer with a lecturer beforehand if you want to demo your dashboard in front of a live audience.
Codebook
| Variable | Data type | Description | Data source |
|---|---|---|---|
| BuurtCode | String | Neighbourhood ID | Youth care database |
| BuurtNaam | String | Neighbourhood name | Youth care database |
| ClientAchternaam | String | Client's last name | Youth care database |
| ClientGeboorteJaar | Integer | Client's birth year | Youth care database |
| ClientGeslacht | String | Client's biological sex | Youth care database |
| ClientKey | Integer | Client ID | VNG/WaarStaatJeGemeente |
| Clienttussenvoegsel | String | Client's middle name | Youth care database |
| Clientvoornamen | String | Client's first name | Youth care database |
| Datum | date | Date of NotaRegelBedrag | Youth care database |
| DrankGebruik | Integer | The percentage of people aged 19 and older who drink no alcohol or at most one glass of alcohol per day. | RIVM |
| EducationalAttainmentLow | Integer | The proportion of the labor force with a low level of education aged 18-74 for every 1000 inhabitants . This includes education at the level of primary education, VMBO, the first 3 years of HAVO/VWO or the assistant training (MBO-1). | VNG/WaarStaatJeGemeente |
| GemeenteCode | String | Municipality ID | CBS/SN |
| GemeenteCode | Integer | Municipality ID | Youth care database |
| GemeenteNaam | String | Municipality name | CBS/SN |
| GemeenteNaam | String | Municipality name | Youth care database |
| GoedErvarenGezondheid | Integer | The percentage of people aged 19 and older with an answer category ‘very good' or ‘good' to the question about general health status. | RIVM |
| HoogRisicoDepressie | Integer | The percentage of people aged 19 and older who are at risk of suffering from an anxiety disorder or depression | RIVM |
| IncomeLow | Float | The lowest 10% of all standardized incomes group. | VNG/WaarStaatJeGemeente |
| LangdurigeZiekteAandoening | Integer | The percentage of people aged 19 and older who answered yes to the question, ‘Do you have one or more long-term illnesses or conditions? Long-term is (expected to be) 6 months or longer'. | RIVM |
| MantelzorgGeven | Integer | The percentage of people aged 19 and older who provide informal care (at least 8 hours a week and/or longer than 3 months). | RIVM |
| NotaKey | Integer | Youth care invoice ID | Youth care database |
| NotaRegelBedrag | Float | Youth care invoice | Youth care database |
| Overgewicht | Integer | The percentage of individuals aged 19 years and older with a Body Mass Index (BMI) of 25.0 kg/m2 and above, based on self-reported height and weight. | RIVM |
| ProductKey | Integer | Youth care product ID | Youth care database |
| ProductNaam | String | Youth care product name | Youth care database |
| Roker | Integer | The percentage of people aged 19 and older who answered the question ‘Do you ever smoke?' answers with ‘yes', excluding electronic cigarette. | RIVM |
| Unemployment | Float | The percentage of persons without paid work, who have recently looked for work and are immediately available for it. | VNG/WaarStaatJeGemeente |
| UnemploymentBenefits | Float | The number of people who receive benefits under the social assistance act or social assistance-related law aged 18 or older for every 1000 inhabitants. | VNG/WaarStaatJeGemeente |
| VoldoenBeweegrichtlijnen | Integer | The percentage of people aged 19 and older that comply with the Exercise Directive. | RIVM |
| ZorgleverancierKey | Integer | Youth care supplier ID | Youth care database |
| ZorgleverancierNaam | String | Youth care supplier name | Youth care database |
Literature
Batra, R. (2018). SQL Primer: An Accelerated Introduction to SQL Basics. (Freely accessible through BUAS's MetaSearch!)
Database data Warehousing Guide. (2017, June 07). Retrieved June 30, 2021, from https://docs.oracle.com/database/121/DWHSG/toc.htm
Kesselman, Y., Osborne, P., Neely, M., & Bencic, T. (2021, April 2). Power BI security white paper - Power BI. Retrieved June 30, 2021, from https://docs.microsoft.com/en-us/power-bi/guidance/whitepaper-powerbi-security
Master a skill - design databases with postgresql. (n.d.). Retrieved June 30, 2021, from https://www.codecademy.com/learn/paths/design-databases-with-postgresql
Optimization guide for Power BI - Power BI. (2021, April 2). Retrieved June 30, 2021, from https://docs.microsoft.com/en-gb/power-bi/guidance/power-bi-optimization
Visualization types in Power BI - Power BI. (2021, March 18). Retrieved June 30, 2021, from https://docs.microsoft.com/en-us/power-bi/visuals/power-bi-visualization-types-for-reports-and-q-and-a#feedback
Stull, E. (2018). UX Fundamentals for Non-UX Professionals: User Experience Principles for Managers, Writers, Designers, and Developers. Berkeley, CA: Apress. (Freely accessible through BUAS' MetaSearch!)